FameEX Weekly Market Trend | July 10, 2023
2023-07-10 17:59:45
1. Market Trend
Between July 6 and July 9, the BTC price fluctuated between $29,701.02 and $31,500.00, with a volatility of 6.05%. Based on the 1-hour candle chart, starting from 1:00 PM on July 6, there was a new round of upward trend, reaching a high point of $31,500 (as mentioned in the previous analysis report, special attention was given to the breakthrough and stabilization at the $31,500 level). However, it failed to stabilize and declined to a support level of $29,701. Currently, the BTC price is still trading sideways above $30,000. On the 4-hour timeframe, the sideways movement has lasted for over two weeks, with the range between $29,500 and $31,500 serving as a consolidation zone. Over time, the moving averages are shifting downwards, increasing the probability of a breakout from the consolidation range (up or down). Breakouts of this nature tend to occur rapidly with significant amplitudes. Continuing from the previous analysis, the focus remains on the range between $29,500 and $31,500, as potential opportunities may arise near these levels (while sacrificing intermediate-term profits and patiently waiting for the target levels). (Please bear in mind that this is an individual opinion and does not constitute investment advice.)
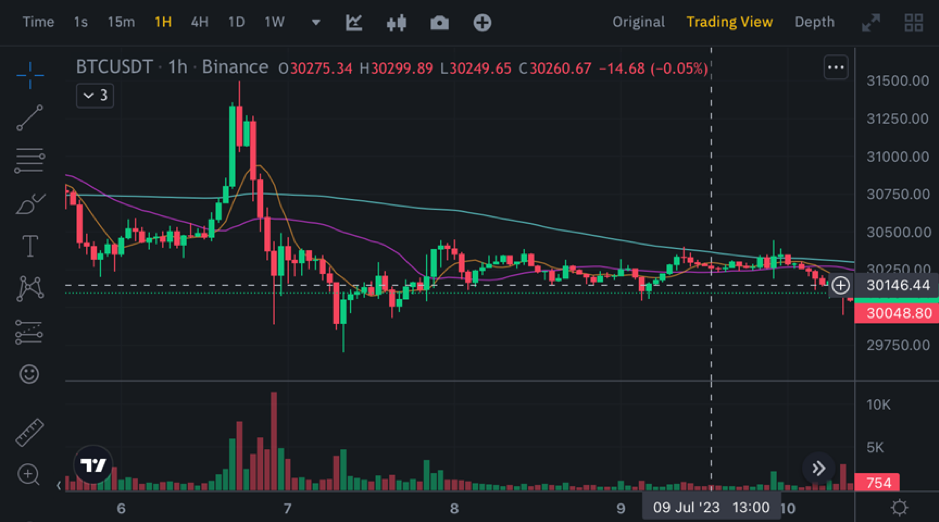
Source: BTCUSDT | Binance Spot
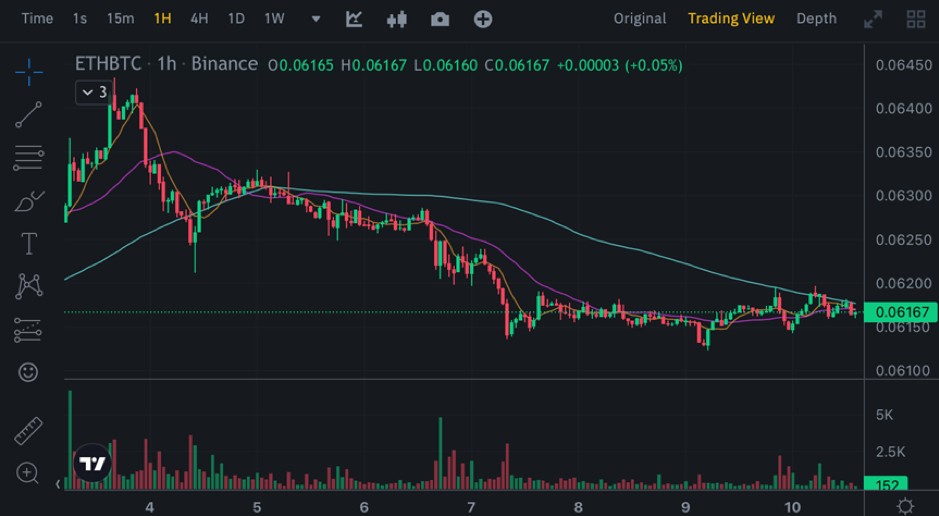
Between July 6 and July 9, the price of ETH/BTC fluctuated within a range of 0.06123 to 0.06286, showing a 2.66% fluctuation. From the one-hour candlestick chart, the ETH/BTC pair might show signs of reentering a downtrend. The 7-day and 25-day moving averages have transitioned from support to resistance, consistently suppressing the coin’s price. Following BTC’s lead, there is a trend of decline without participating in the upward movements, reflecting the current weakness. In the near term, it is still advised to observe ETH/BTC and avoid taking action as much as possible.
Based on overall analysis, currently, most cryptocurrencies are waiting for a breakthrough signal from BTC, following its market trends in terms of ups and downs. There are essentially no cryptos with independent market trends. In such a situation, it is wise to avoid trading altcoins. Once BTC makes a decision, altcoins tend to experience significant volatility (remember that preserving principal is always more important than chasing returns). It is crucial to exercise patience and wait for key points to be reached.
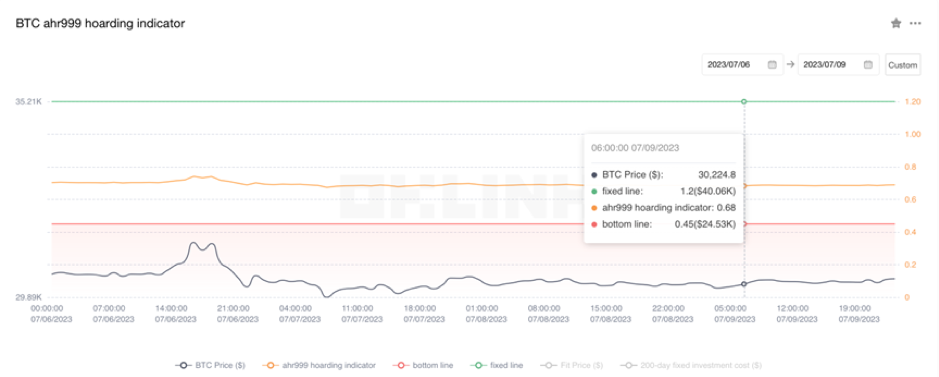
The Bitcoin Ahr999 index of 0.68 is above the buy-the-dip level ($24,530) but below the DCA level ($40,060). It is viable to purchase popular coins through DCA.
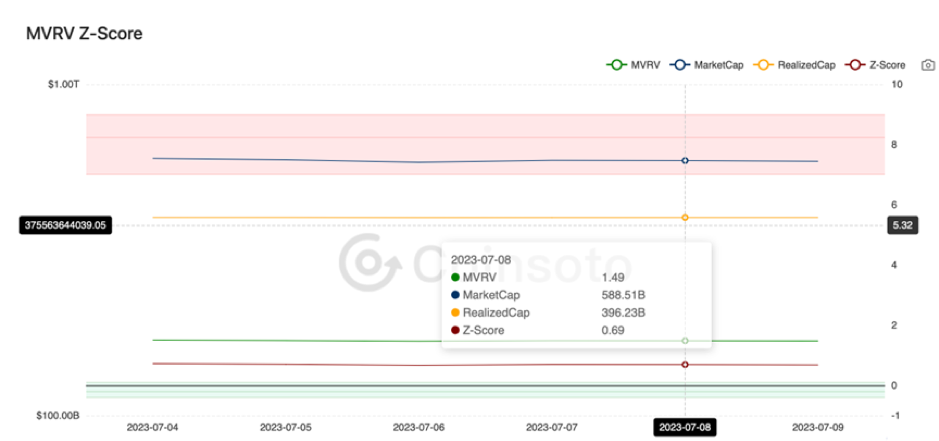
From the perspective of MVRV Z-Score, the value is 0.69. When the value is greater than 6, it enters the market tops, while a value below 2 indicates that it enters the market bottoms. Currently, the present value exceeds the buy-the-dip range (-0.42-0.06).
2. Perpetual Futures
In general, the 7-day cumulative funding rates for the popular coins across major exchanges are positive, indicating that long leverages are relatively high.

The contract open interest of BTC and ETH experienced a downtrend on July 6, followed by a stable period thereafter.
Exchange BTC Contract Open Interest:

Exchange ETH Contract Open Interest:

3. Industry Roundup
1) On July 6, BlackRock CEO stated that Bitcoin is an international asset.
2) On July 6, Twitter obtained licenses from three U.S. states for money transfers.
3) On July 6, Binance announced that it would deactivate the current deposit addresses in the third quarter and advised affected users to obtain new deposit addresses.
4) On July 7, Binance’s Chief Strategy Officer decided to resign.
5) On July 7, the U.S. added 209,000 jobs in non-farm payrolls for June, slightly below the estimated 230,000 jobs.
6) On July 8, Ripple Labs announced a pilot project for tokenization of real estate.
7) On July 8, the National Blockchain Technology (Marine Economy) Innovation Center started its construction.
8) On July 9, NFT sales for the week decreased by 23%.
9) On July 9, whales purchased over 1.1 billion XRP since the end of February.
10) On July 9, data showed that as of July 6th, the circulating supply of USDC dropped again to 27.5 billion tokens.
Disclaimer: FameEX makes no representations on the accuracy or suitability of any official statements made by the exchange regarding the data in this area or any related financial advice.
