
 Markets
 Referral & Affiliate
 Rewards
 Products
 Support Center
 News
News Research
 Download
 English
What Is RSI Indicator in Trading and How to Use It?
2023/03/31 16:09:05
Preface: Brief Intro to the RSI Indicator
Invented by J. Welles Wilder in 1978, the Relative Strength Index (RSI) indicator is used to evaluate the overbought and oversold conditions in the market. It is one of the important tools for identifying overbought and oversold markets. This indicator identifies whether the crypto market is strong or weak by calculating the changes in the closing prices within a certain period of time, and then generates trading signals.
What Is the RSI Indicator?
The RSI indicator measures the overbought and oversold conditions of cryptos and calculates entry and exit points in trading strategies. Its calculation is based on the average of price rises and drops over a past period, usually for a period of 14 days. The value of the RSI indicator is bounded from 0 to 100. An RSI reading of over 70 indicates an overbought signal. Furthermore, if the value is less than 30, it gives an oversold signal.
What Is the Formula to Calculate the RSI Indicator?
1. Calculate the average gain.
Average gain = (Sum of positive price changes over N days) / N
2. Calculate the average loss.
Average loss = (Sum of negative price changes over N days) / N
3. Calculate the RSI value.
RSI = 100 - [100 / (1 + (Average gain / Average loss))]
N is a parameter, usually taken as 14 days.
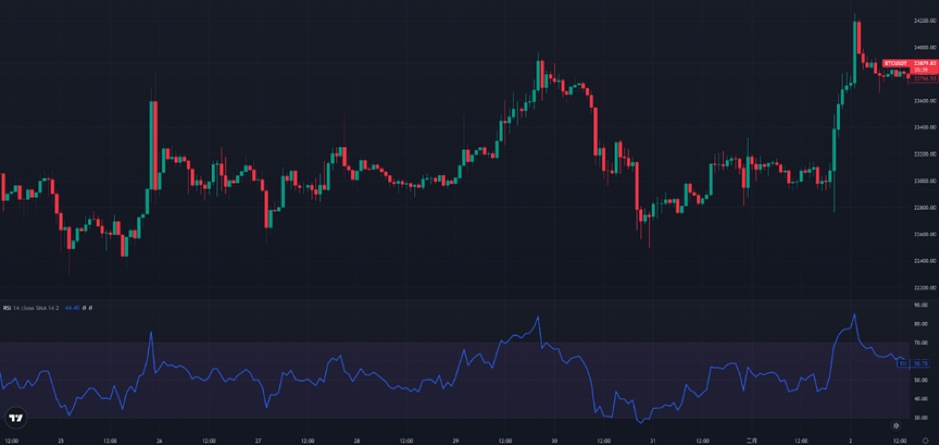
As shown in the figure below, the line in blue refers to the RSI indicator.
What Are RSI’s Principles and Features and How to Use it to Identify Market Trends?
According to the RSI indicator principle, the ups and downs of the RSI indicator are positively correlated with the market trend. When the RSI indicator is above 70, it gives an overbought signal, which means that the market may have a pullback or correction. If the RSI indicator is below 30, it is usually interpreted as an oversold signal, indicating the chance that the market may rebound or rise.

Features of the RSI Indicator:
1. Evaluation of the market strength in the short and medium term: The RSI indicator measures the strength of the cryptocurrency by calculating the average gain or loss over the past period of time.
2. Useful overbought and oversold signals: An RSI score of over 70 usually refers to an overbought signal, while the score of below 30 usually represents an oversold signal, helping traders make trading strategies.
3. Ease to use: The calculation method of the RSI indicator is simple and easy to understand. It only needs to calculate the changes in the closing prices within a certain period of time.
4. Extensive applications: The RSI indicator has a broad range of use across various markets, including cryptocurrencies, stocks, futures, foreign exchange, etc.
Common RSI Patterns
The RSI indicator is relatively easy to interpret. It tells the strength and weakness of the market via the range of 0-100 scores. Furthermore, it can be used along with price trends to identify market strength.
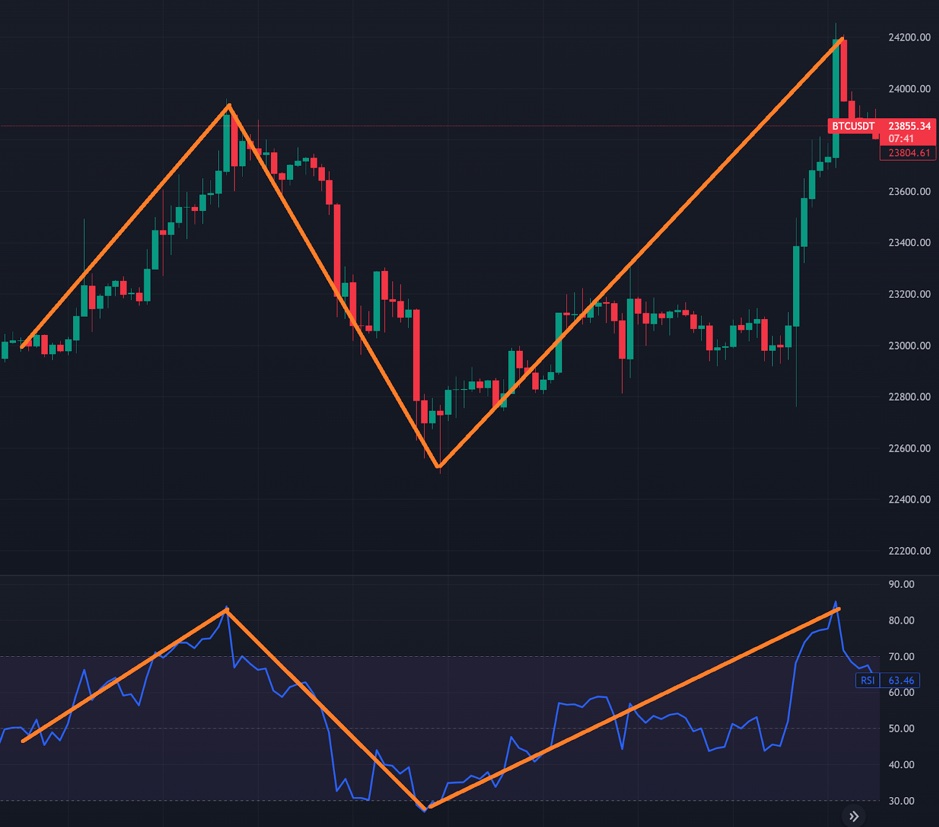
RSI Trend Proportional to the Price
It's common for prices to rise or fall in response to an upward or downward RSI, respectively, which indicates that the market is more likely to continue moving in its original direction.
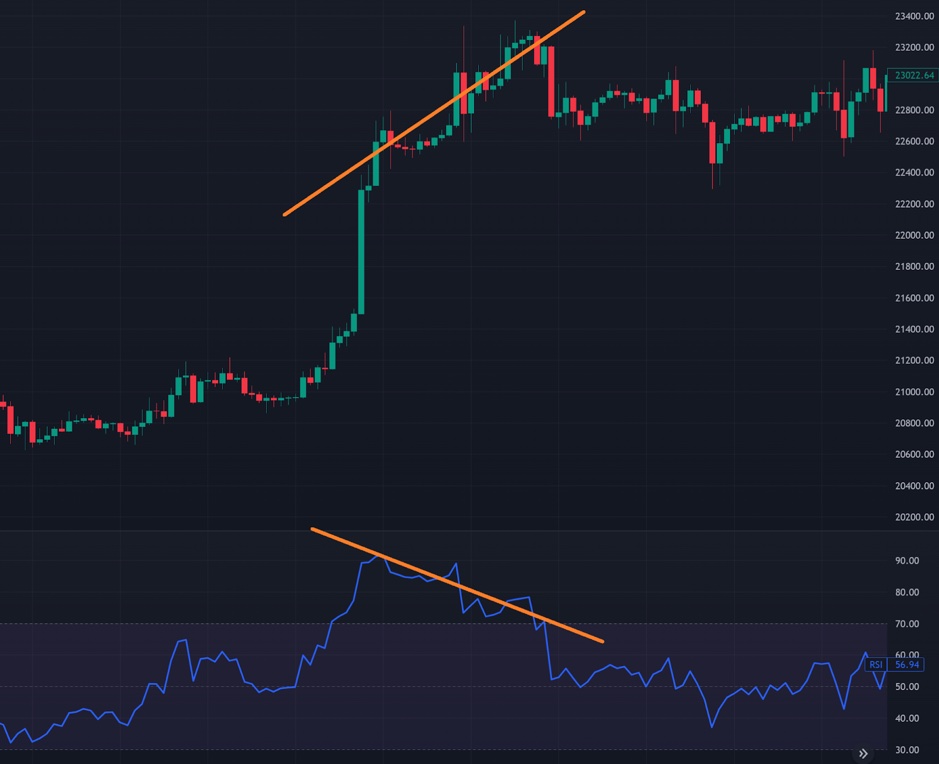
RSI Divergence
In technical analysis, RSI divergence indicates that the trend of the market price is the reverse of the RSI trend. The most common situation in RSI divergence occurs when the price of an asset is moving in a different direction than the RSI indicator. There are two situations that can occur with RSI divergence. The first is when the price of an asset is making higher highs, but the RSI indicator is making lower highs. The second is when the price of an asset is making lower lows, but the RSI indicator is making higher lows. In both cases, this could be a sign that the price is about to reverse and the trend may shift.
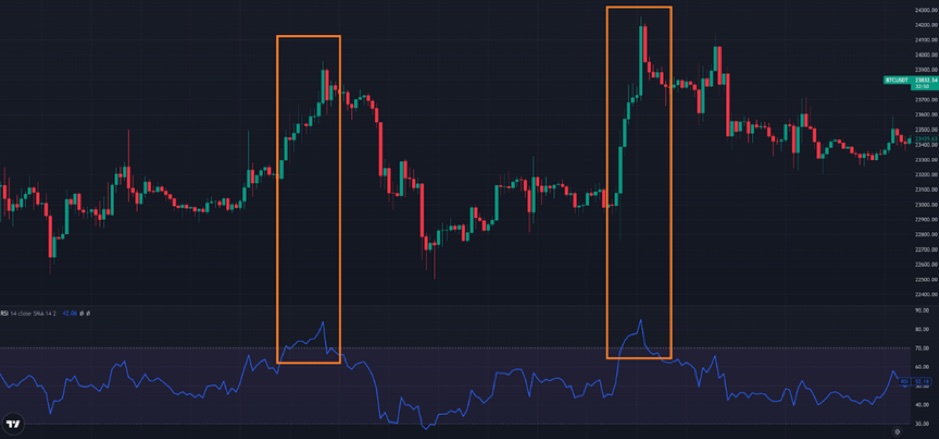
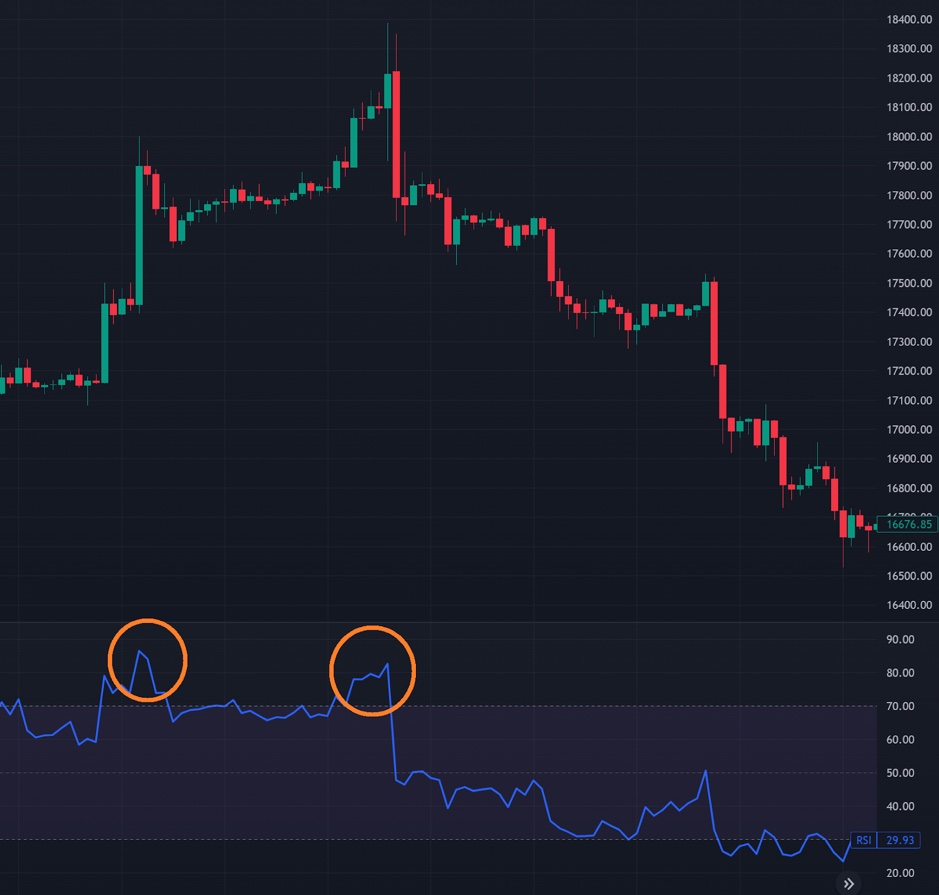
Double Top Pattern
As a common technical analysis pattern, an RSI double top usually appears in case of the upcoming reverse of the market trend. The following conditions are required to form the RSI double top:
1. It is required that the market remains an upward trend, and the RSI value has reached or exceeded 70. Thus, the first top pattern is formed.
2. Later, the market trend experiences a correction, and the RSI value drops below 70.
3. When the market trend falls to a certain extent, the RSI value begins to rise. However, the rebound range usually does not exceed the previous high point, forming the second top pattern. Generally, this creates an M-shaped pattern on the candlestick chart.
The double top pattern is typically interpreted as a signal that the market is about to reverse, meaning it’s turning from an uptrend to a downtrend. Traders can use this pattern to pay attention to changes in the market trend and formulate corresponding sell strategies.
How to Use the RSI Indicator?
The RSI indicator is conducive to identifying overbought and oversold conditions of trading assets and telling the strength of the market trends. It can be used as follows:
1. Overbought and oversold signals: An RSI score over 70 is usually interpreted as an overbought signal, indicating that there may be opportunities for pullbacks or corrections in the market, and you can sell out or go short. If the score is lower than 30, it gives an oversold signal, which means that the market may rebound or rise. Thus, you can buy in or go long.
2. Trend analysis: Traders can identify the strength of the market trend by observing the change in the RSI indicator value and the market trend. If the value of the RSI indicator is at a high level for quite some time along with a strong market trend, it indicates a strong uptrend of the market. Conversely, the RSI indicator value at a low level for a long time combined with a weak market trend refers to a weak downtrend of the market.
3. Divergence analysis: RSI divergence indicates that the trend of the market price is the reverse of the RSI trend, which helps traders identify the turning point and strength of the market trend. Generally, the RSI divergence represents a warning sign of an impending market reversal.
Can the RSI Indicator Work with Others?
The RSI indicator can be used along with other tools, such as the Moving Average Convergence Divergence (MACD) indicator, the Simple Moving Average (SMA) indicator, candlestick patterns, and other technical indicators, to improve the accuracy of technical analysis. It can also be used together with fundamental analysis.
Conclusion
The RSI indicator can help traders identify whether the market is overbought or oversold, as well as determine the medium- and short-term trends. It is important to note, however, that the RSI indicator is only a technical analysis tool and shouldn’t be used alone for trading decisions. To reduce risks and improve trade accuracy, it’s recommended to combine the RSI indicator with other technical analysis tools and fundamental analysis for comprehensive judgments.
FAQ
Q: How to use the RSI indicator in crypto trading?
A: If the RSI value goes beyond 70, it suggests an overbought market, creating a favorable circumstance to sell out or go short. On the other hand, when the RSI value drops below 30, it implies an oversold market, providing a chance to buy in or go long.
Q: Which technical analysis indicator is the best partner for the RSI indicator?
A: The RSI indicator goes along with the MACD indicator. The former excels in identifying medium- and short-term trends, while the latter is for the identification of medium- and long-term trends.
This is not investment advice. Please conduct your own research when investing in any project.


